Modeldrift with Eurybia
With this tutorial you: Understand how to use Eurybia to detect model drift
This tutorial contains only additional features of model drift. For more detailed information on data drift, you can consult these tutorials : (https://github.com/MAIF/eurybia/tree/master/tutorial/data_drift)
[11]:
import pandas as pd
import numpy as np
from datetime import date
from category_encoders import OrdinalEncoder
from lightgbm import LGBMRegressor
from eurybia import SmartDrift
from eurybia.data.data_loader import data_loading
from sklearn.model_selection import train_test_split
from sklearn.metrics import mean_squared_log_error
Import Dataset and split in training and production dataset
[3]:
house_df, house_dict = data_loading('house_prices')
[4]:
# Let us consider that the column "YrSold" corresponds to the reference date.
#In 2006, a model was trained using data. And in 2007, we want to detect data drift on new data in production to predict
#house price
house_df_learning = house_df.loc[house_df['YrSold'] == 2006]
house_df_2007 = house_df.loc[house_df['YrSold'] == 2007]
[5]:
y_df_learning=house_df_learning['SalePrice'].to_frame()
X_df_learning=house_df_learning[house_df_learning.columns.difference(['SalePrice','YrSold'])]

y_df_2007=house_df_2007['SalePrice'].to_frame()
X_df_2007=house_df_2007[house_df_2007.columns.difference(['SalePrice','YrSold'])]
Building Supervized Model
[6]:
from category_encoders import OrdinalEncoder

categorical_features = [col for col in X_df_learning.columns if X_df_learning[col].dtype == 'object']

encoder = OrdinalEncoder(
    cols=categorical_features,
    handle_unknown='ignore',
    return_df=True).fit(X_df_learning)

X_df_learning_encoded=encoder.transform(X_df_learning)
[7]:
Xtrain, Xtest, ytrain, ytest = train_test_split(X_df_learning_encoded, y_df_learning, train_size=0.75, random_state=1)
[8]:
regressor = LGBMRegressor(n_estimators=200).fit(Xtrain,ytrain)
[LightGBM] [Info] Auto-choosing row-wise multi-threading, the overhead of testing was 0.000667 seconds.
You can set `force_row_wise=true` to remove the overhead.
And if memory is not enough, you can set `force_col_wise=true`.
[LightGBM] [Info] Total Bins 1020
[LightGBM] [Info] Number of data points in the train set: 235, number of used features: 53
[LightGBM] [Info] Start training from score 181743.472340
[LightGBM] [Warning] No further splits with positive gain, best gain: -inf
[LightGBM] [Warning] No further splits with positive gain, best gain: -inf
[LightGBM] [Warning] No further splits with positive gain, best gain: -inf
[LightGBM] [Warning] No further splits with positive gain, best gain: -inf
[LightGBM] [Warning] No further splits with positive gain, best gain: -inf
[LightGBM] [Warning] No further splits with positive gain, best gain: -inf
[LightGBM] [Warning] No further splits with positive gain, best gain: -inf
[LightGBM] [Warning] No further splits with positive gain, best gain: -inf
[LightGBM] [Warning] No further splits with positive gain, best gain: -inf
[LightGBM] [Warning] No further splits with positive gain, best gain: -inf
[LightGBM] [Warning] No further splits with positive gain, best gain: -inf
[LightGBM] [Warning] No further splits with positive gain, best gain: -inf
[LightGBM] [Warning] No further splits with positive gain, best gain: -inf
[LightGBM] [Warning] No further splits with positive gain, best gain: -inf
[LightGBM] [Warning] No further splits with positive gain, best gain: -inf
[LightGBM] [Warning] No further splits with positive gain, best gain: -inf
[LightGBM] [Warning] No further splits with positive gain, best gain: -inf
[LightGBM] [Warning] No further splits with positive gain, best gain: -inf
[LightGBM] [Warning] No further splits with positive gain, best gain: -inf
[LightGBM] [Warning] No further splits with positive gain, best gain: -inf
[LightGBM] [Warning] No further splits with positive gain, best gain: -inf
[LightGBM] [Warning] No further splits with positive gain, best gain: -inf
[LightGBM] [Warning] No further splits with positive gain, best gain: -inf
[LightGBM] [Warning] No further splits with positive gain, best gain: -inf
[LightGBM] [Warning] No further splits with positive gain, best gain: -inf
[LightGBM] [Warning] No further splits with positive gain, best gain: -inf
[LightGBM] [Warning] No further splits with positive gain, best gain: -inf
[LightGBM] [Warning] No further splits with positive gain, best gain: -inf
[LightGBM] [Warning] No further splits with positive gain, best gain: -inf
[LightGBM] [Warning] No further splits with positive gain, best gain: -inf
[LightGBM] [Warning] No further splits with positive gain, best gain: -inf
[LightGBM] [Warning] No further splits with positive gain, best gain: -inf
[LightGBM] [Warning] No further splits with positive gain, best gain: -inf
[LightGBM] [Warning] No further splits with positive gain, best gain: -inf
[LightGBM] [Warning] No further splits with positive gain, best gain: -inf
[LightGBM] [Warning] No further splits with positive gain, best gain: -inf
[LightGBM] [Warning] No further splits with positive gain, best gain: -inf
[LightGBM] [Warning] No further splits with positive gain, best gain: -inf
[LightGBM] [Warning] No further splits with positive gain, best gain: -inf
[LightGBM] [Warning] No further splits with positive gain, best gain: -inf
[LightGBM] [Warning] No further splits with positive gain, best gain: -inf
[LightGBM] [Warning] No further splits with positive gain, best gain: -inf
[LightGBM] [Warning] No further splits with positive gain, best gain: -inf
[LightGBM] [Warning] No further splits with positive gain, best gain: -inf
[LightGBM] [Warning] No further splits with positive gain, best gain: -inf
[LightGBM] [Warning] No further splits with positive gain, best gain: -inf
[LightGBM] [Warning] No further splits with positive gain, best gain: -inf
[LightGBM] [Warning] No further splits with positive gain, best gain: -inf
[LightGBM] [Warning] No further splits with positive gain, best gain: -inf
[LightGBM] [Warning] No further splits with positive gain, best gain: -inf
[LightGBM] [Warning] No further splits with positive gain, best gain: -inf
[LightGBM] [Warning] No further splits with positive gain, best gain: -inf
[LightGBM] [Warning] No further splits with positive gain, best gain: -inf
[LightGBM] [Warning] No further splits with positive gain, best gain: -inf
[LightGBM] [Warning] No further splits with positive gain, best gain: -inf
[LightGBM] [Warning] No further splits with positive gain, best gain: -inf
[LightGBM] [Warning] No further splits with positive gain, best gain: -inf
[LightGBM] [Warning] No further splits with positive gain, best gain: -inf
[LightGBM] [Warning] No further splits with positive gain, best gain: -inf
[LightGBM] [Warning] No further splits with positive gain, best gain: -inf
[LightGBM] [Warning] No further splits with positive gain, best gain: -inf
[LightGBM] [Warning] No further splits with positive gain, best gain: -inf
[LightGBM] [Warning] No further splits with positive gain, best gain: -inf
[LightGBM] [Warning] No further splits with positive gain, best gain: -inf
[LightGBM] [Warning] No further splits with positive gain, best gain: -inf
[LightGBM] [Warning] No further splits with positive gain, best gain: -inf
[LightGBM] [Warning] No further splits with positive gain, best gain: -inf
[LightGBM] [Warning] No further splits with positive gain, best gain: -inf
[LightGBM] [Warning] No further splits with positive gain, best gain: -inf
[LightGBM] [Warning] No further splits with positive gain, best gain: -inf
[LightGBM] [Warning] No further splits with positive gain, best gain: -inf
[LightGBM] [Warning] No further splits with positive gain, best gain: -inf
[LightGBM] [Warning] No further splits with positive gain, best gain: -inf
[LightGBM] [Warning] No further splits with positive gain, best gain: -inf
[LightGBM] [Warning] No further splits with positive gain, best gain: -inf
[LightGBM] [Warning] No further splits with positive gain, best gain: -inf
[LightGBM] [Warning] No further splits with positive gain, best gain: -inf
[LightGBM] [Warning] No further splits with positive gain, best gain: -inf
[LightGBM] [Warning] No further splits with positive gain, best gain: -inf
[LightGBM] [Warning] No further splits with positive gain, best gain: -inf
[LightGBM] [Warning] No further splits with positive gain, best gain: -inf
[LightGBM] [Warning] No further splits with positive gain, best gain: -inf
[LightGBM] [Warning] No further splits with positive gain, best gain: -inf
[LightGBM] [Warning] No further splits with positive gain, best gain: -inf
[LightGBM] [Warning] No further splits with positive gain, best gain: -inf
[LightGBM] [Warning] No further splits with positive gain, best gain: -inf
[LightGBM] [Warning] No further splits with positive gain, best gain: -inf
[LightGBM] [Warning] No further splits with positive gain, best gain: -inf
[LightGBM] [Warning] No further splits with positive gain, best gain: -inf
[LightGBM] [Warning] No further splits with positive gain, best gain: -inf
[LightGBM] [Warning] No further splits with positive gain, best gain: -inf
[LightGBM] [Warning] No further splits with positive gain, best gain: -inf
[LightGBM] [Warning] No further splits with positive gain, best gain: -inf
[LightGBM] [Warning] No further splits with positive gain, best gain: -inf
[LightGBM] [Warning] No further splits with positive gain, best gain: -inf
[LightGBM] [Warning] No further splits with positive gain, best gain: -inf
[LightGBM] [Warning] No further splits with positive gain, best gain: -inf
[LightGBM] [Warning] No further splits with positive gain, best gain: -inf
[LightGBM] [Warning] No further splits with positive gain, best gain: -inf
[LightGBM] [Warning] No further splits with positive gain, best gain: -inf
[LightGBM] [Warning] No further splits with positive gain, best gain: -inf
[LightGBM] [Warning] No further splits with positive gain, best gain: -inf
[LightGBM] [Warning] No further splits with positive gain, best gain: -inf
[LightGBM] [Warning] No further splits with positive gain, best gain: -inf
[LightGBM] [Warning] No further splits with positive gain, best gain: -inf
[LightGBM] [Warning] No further splits with positive gain, best gain: -inf
[LightGBM] [Warning] No further splits with positive gain, best gain: -inf
[LightGBM] [Warning] No further splits with positive gain, best gain: -inf
[LightGBM] [Warning] No further splits with positive gain, best gain: -inf
[LightGBM] [Warning] No further splits with positive gain, best gain: -inf
[LightGBM] [Warning] No further splits with positive gain, best gain: -inf
[LightGBM] [Warning] No further splits with positive gain, best gain: -inf
[LightGBM] [Warning] No further splits with positive gain, best gain: -inf
[LightGBM] [Warning] No further splits with positive gain, best gain: -inf
[LightGBM] [Warning] No further splits with positive gain, best gain: -inf
[LightGBM] [Warning] No further splits with positive gain, best gain: -inf
[LightGBM] [Warning] No further splits with positive gain, best gain: -inf
[LightGBM] [Warning] No further splits with positive gain, best gain: -inf
[LightGBM] [Warning] No further splits with positive gain, best gain: -inf
[LightGBM] [Warning] No further splits with positive gain, best gain: -inf
[LightGBM] [Warning] No further splits with positive gain, best gain: -inf
[LightGBM] [Warning] No further splits with positive gain, best gain: -inf
[LightGBM] [Warning] No further splits with positive gain, best gain: -inf
[LightGBM] [Warning] No further splits with positive gain, best gain: -inf
[LightGBM] [Warning] No further splits with positive gain, best gain: -inf
[LightGBM] [Warning] No further splits with positive gain, best gain: -inf
[LightGBM] [Warning] No further splits with positive gain, best gain: -inf
[LightGBM] [Warning] No further splits with positive gain, best gain: -inf
[LightGBM] [Warning] No further splits with positive gain, best gain: -inf
[LightGBM] [Warning] No further splits with positive gain, best gain: -inf
[LightGBM] [Warning] No further splits with positive gain, best gain: -inf
[LightGBM] [Warning] No further splits with positive gain, best gain: -inf
[LightGBM] [Warning] No further splits with positive gain, best gain: -inf
[LightGBM] [Warning] No further splits with positive gain, best gain: -inf
[LightGBM] [Warning] No further splits with positive gain, best gain: -inf
[LightGBM] [Warning] No further splits with positive gain, best gain: -inf
[LightGBM] [Warning] No further splits with positive gain, best gain: -inf
[LightGBM] [Warning] No further splits with positive gain, best gain: -inf
[LightGBM] [Warning] No further splits with positive gain, best gain: -inf
[LightGBM] [Warning] No further splits with positive gain, best gain: -inf
[LightGBM] [Warning] No further splits with positive gain, best gain: -inf
[LightGBM] [Warning] No further splits with positive gain, best gain: -inf
[LightGBM] [Warning] No further splits with positive gain, best gain: -inf
[LightGBM] [Warning] No further splits with positive gain, best gain: -inf
[LightGBM] [Warning] No further splits with positive gain, best gain: -inf
[LightGBM] [Warning] No further splits with positive gain, best gain: -inf
[LightGBM] [Warning] No further splits with positive gain, best gain: -inf
[LightGBM] [Warning] No further splits with positive gain, best gain: -inf
[LightGBM] [Warning] No further splits with positive gain, best gain: -inf
[LightGBM] [Warning] No further splits with positive gain, best gain: -inf
[LightGBM] [Warning] No further splits with positive gain, best gain: -inf
[LightGBM] [Warning] No further splits with positive gain, best gain: -inf
[LightGBM] [Warning] No further splits with positive gain, best gain: -inf
[LightGBM] [Warning] No further splits with positive gain, best gain: -inf
[LightGBM] [Warning] No further splits with positive gain, best gain: -inf
[LightGBM] [Warning] No further splits with positive gain, best gain: -inf
[LightGBM] [Warning] No further splits with positive gain, best gain: -inf
[LightGBM] [Warning] No further splits with positive gain, best gain: -inf
[LightGBM] [Warning] No further splits with positive gain, best gain: -inf
[LightGBM] [Warning] No further splits with positive gain, best gain: -inf
[LightGBM] [Warning] No further splits with positive gain, best gain: -inf
[LightGBM] [Warning] No further splits with positive gain, best gain: -inf
[LightGBM] [Warning] No further splits with positive gain, best gain: -inf
[LightGBM] [Warning] No further splits with positive gain, best gain: -inf
[LightGBM] [Warning] No further splits with positive gain, best gain: -inf
[LightGBM] [Warning] No further splits with positive gain, best gain: -inf
[LightGBM] [Warning] No further splits with positive gain, best gain: -inf
[LightGBM] [Warning] No further splits with positive gain, best gain: -inf
[LightGBM] [Warning] No further splits with positive gain, best gain: -inf
[LightGBM] [Warning] No further splits with positive gain, best gain: -inf
[LightGBM] [Warning] No further splits with positive gain, best gain: -inf
[LightGBM] [Warning] No further splits with positive gain, best gain: -inf
[LightGBM] [Warning] No further splits with positive gain, best gain: -inf
[LightGBM] [Warning] No further splits with positive gain, best gain: -inf
[LightGBM] [Warning] No further splits with positive gain, best gain: -inf
[LightGBM] [Warning] No further splits with positive gain, best gain: -inf
[LightGBM] [Warning] No further splits with positive gain, best gain: -inf
[LightGBM] [Warning] No further splits with positive gain, best gain: -inf
[LightGBM] [Warning] No further splits with positive gain, best gain: -inf
[LightGBM] [Warning] No further splits with positive gain, best gain: -inf
[LightGBM] [Warning] No further splits with positive gain, best gain: -inf
[LightGBM] [Warning] No further splits with positive gain, best gain: -inf
[LightGBM] [Warning] No further splits with positive gain, best gain: -inf
[LightGBM] [Warning] No further splits with positive gain, best gain: -inf
[LightGBM] [Warning] No further splits with positive gain, best gain: -inf
[LightGBM] [Warning] No further splits with positive gain, best gain: -inf
[LightGBM] [Warning] No further splits with positive gain, best gain: -inf
[LightGBM] [Warning] No further splits with positive gain, best gain: -inf
[LightGBM] [Warning] No further splits with positive gain, best gain: -inf
[LightGBM] [Warning] No further splits with positive gain, best gain: -inf
[LightGBM] [Warning] No further splits with positive gain, best gain: -inf
[LightGBM] [Warning] No further splits with positive gain, best gain: -inf
[LightGBM] [Warning] No further splits with positive gain, best gain: -inf
[LightGBM] [Warning] No further splits with positive gain, best gain: -inf
[LightGBM] [Warning] No further splits with positive gain, best gain: -inf
[LightGBM] [Warning] No further splits with positive gain, best gain: -inf
[LightGBM] [Warning] No further splits with positive gain, best gain: -inf
[LightGBM] [Warning] No further splits with positive gain, best gain: -inf
[LightGBM] [Warning] No further splits with positive gain, best gain: -inf
[LightGBM] [Warning] No further splits with positive gain, best gain: -inf
Use Eurybia for data drift
[13]:
X_df_2007["MasVnrType"] = X_df_2007["MasVnrType"].fillna("NR")
X_df_learning["MasVnrType"] = X_df_learning["MasVnrType"].fillna("NR")
SD = SmartDrift(df_current=X_df_2007,
                df_baseline=X_df_learning,
                deployed_model=regressor, # Optional: put in perspective result with importance on deployed model
                encoding=encoder # Optional: if deployed_model and encoder to use this model
               )
[14]:
%time
SD.compile(full_validation=True, # Optional: to save time, leave the default False value. If True, analyze consistency on modalities between columns.
           date_compile_auc = date(2007,1,1), # Optional: useful when computing the drift for a time that is not now
           datadrift_file = "house_price_auc.csv" # Optional: name of the csv file that contains the performance history of data drift
          )
CPU times: user 7 μs, sys: 1e+03 ns, total: 8 μs
Wall time: 9.78 μs
The variable BsmtCond has mismatching unique values:
['Poor -Severe cracking, settling, or wetness'] | []

The variable Condition2 has mismatching unique values:
['Near positive off-site feature--park, greenbelt, etc.', 'Adjacent to North-South Railroad', 'Adjacent to East-West Railroad'] | ['Adjacent to feeder street']

The variable Electrical has mismatching unique values:
['Mixed'] | ['60 AMP Fuse Box and mostly knob & tube wiring (poor)']

The variable ExterQual has mismatching unique values:
['Fair'] | []

The variable Exterior1st has mismatching unique values:
[] | ['Stone', 'Imitation Stucco']

The variable Exterior2nd has mismatching unique values:
['Asphalt Shingles', 'Brick Common'] | ['Other']

The variable Foundation has mismatching unique values:
[] | ['Stone', 'Wood']

The variable Functional has mismatching unique values:
['Major Deductions 2', 'Severely Damaged'] | ['Moderate Deductions']

The variable GarageQual has mismatching unique values:
[] | ['Excellent']

The variable Heating has mismatching unique values:
[] | ['Wall furnace']

The variable HeatingQC has mismatching unique values:
['Poor'] | []

The variable LotConfig has mismatching unique values:
[] | ['Frontage on 3 sides of property']

The variable MSSubClass has mismatching unique values:
['1-Story w/Finished Attic All Ages'] | []

The variable Neighborhood has mismatching unique values:
['Northpark Villa'] | []

The variable RoofMatl has mismatching unique values:
['Roll'] | ['Metal']

The variable RoofStyle has mismatching unique values:
['Mansard', 'Shed'] | []

The variable SaleType has mismatching unique values:
['Warranty Deed - Cash'] | ['Contract Low Interest', 'Contract Low Down', 'Contract Low Down payment and low interest']

The variable Street has mismatching unique values:
['Gravel'] | []

INFO: Shap explainer type - <shap.explainers._tree.TreeExplainer object at 0x122153ed0>
The computed AUC on the X_test used to build datadrift_classifier is equal to: 0.626082251082251
As soon as compile() method, Eurybia displays default consistency checks as warnings. If some modalities are not present during training and are in production dataset, the deployed model will consider them wrongly. Inversely, if some modalities are present during training and are not in production dataset, it means that some profiles are missing.
Add model drift in report
For the moment, the model drift part of eurybia only consists of displaying performance of deployed model. (We hope to bring new features in the future on this part)
Put model performance in DataFrame
[15]:
y_pred = regressor.predict(Xtest)
[16]:
performance_test = mean_squared_log_error(ytest, y_pred).round(6)
performance_test
[16]:
0.030775
[17]:
#Create Dataframe to track performance over the years
df_performance = pd.DataFrame({'annee': [2006], 'mois':[1], 'performance': [performance_test]})
[18]:
df_2007_encode=encoder.transform(X_df_2007)
y_pred_2007 = regressor.predict(df_2007_encode)
performance_2007 = mean_squared_log_error(y_df_2007, y_pred_2007).round(6)
performance_2007
[18]:
0.032982
[21]:
df_performance = pd.concat([df_performance, pd.DataFrame([{'annee': 2007, 'mois': 1, 'performance': performance_2007}])], ignore_index=True)
df_performance
[21]:
| annee | mois | performance | |
|---|---|---|---|
| 0 | 2006 | 1 | 0.030775 |
| 1 | 2007 | 1 | 0.032982 |
| 2 | 2007 | 1 | 0.032982 |
Add performance Dataframe in Smartdrift
[22]:
SD.add_data_modeldrift(dataset=df_performance,metric='performance')
[23]:
SD.generate_report(
    output_file='report_house_price_modeldrift_2007.html',
    title_story="Data drift",
    title_description="""House price model drift 2007""", # Optional: add a subtitle to describe report
    project_info_file="../../eurybia/data/project_info_house_price.yml" # Optional: add information on report
    )
Eurybia is designed to generate an HTML report for analysis, and less for use in notebook mode. However, to illustrate functionalities, we will detail results with notebook mode analysis.
This tutorial contains only anlysis on additional features of model drift. For more detailed information on data drift, you can consult these tutorials : (https://github.com/MAIF/eurybia/tree/master/tutorial/data_drift)
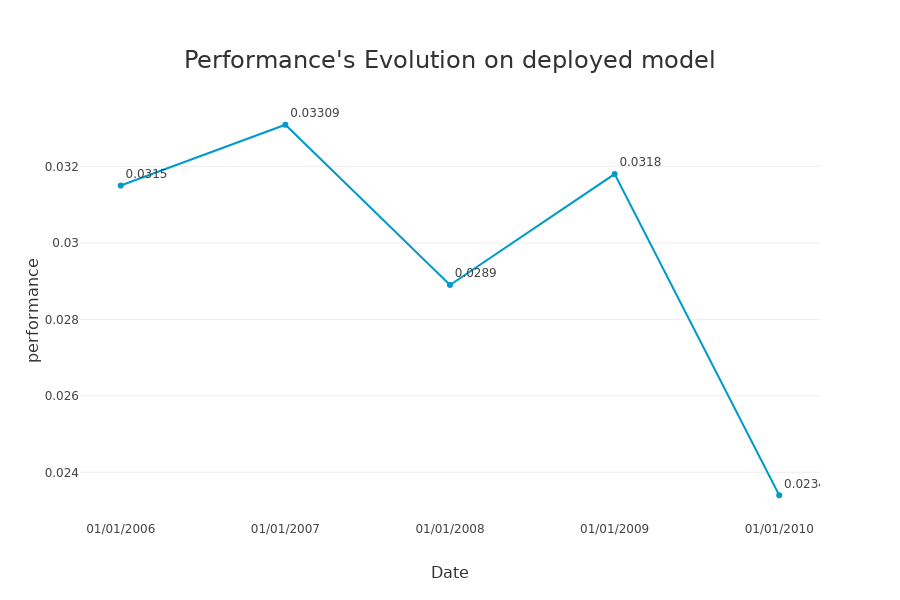
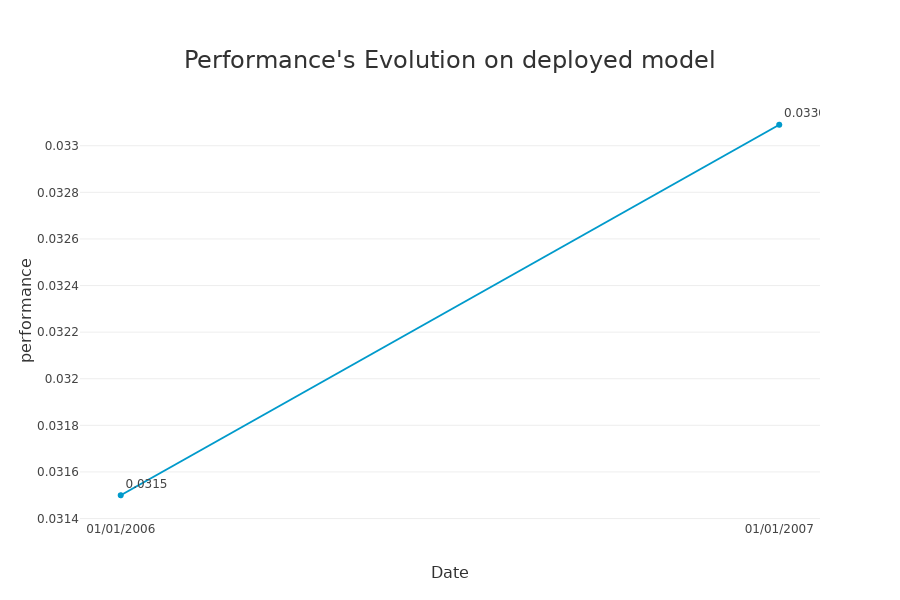
Display model drift
[ ]:
SD.plot.generate_modeldrift_data() # works if date_compile_auc and/or datadrift_file are filled
Display model drift with multiple indicators
If you have several metrics or indicators for performance monitoring, it is possible to have reference columns. Let’s create a dummy performance table to show the use.
[25]:
df_performance_mse = df_performance.copy()
df_performance_mse['performance']= np.exp(df_performance_mse['performance'])
df_performance2 = pd.concat([df_performance, df_performance_mse], keys=["rmse", "mse"]).reset_index().rename(columns={"level_0": "indicator"})
df_performance2
[25]:
| indicator | level_1 | annee | mois | performance | |
|---|---|---|---|---|---|
| 0 | rmse | 0 | 2006 | 1 | 0.030775 |
| 1 | rmse | 1 | 2007 | 1 | 0.032982 |
| 2 | rmse | 2 | 2007 | 1 | 0.032982 |
| 3 | mse | 0 | 2006 | 1 | 1.031253 |
| 4 | mse | 1 | 2007 | 1 | 1.033532 |
| 5 | mse | 2 | 2007 | 1 | 1.033532 |
[26]:
SD.add_data_modeldrift(dataset=df_performance2,metric='performance',reference_columns=['indicator'])
[27]:
SD.generate_report(
    output_file='report_house_price_modeldrift_2007.html',
    title_story="Data drift",
    title_description="""House price model drift 2007""", # Optional: add a subtitle to describe report
    project_info_file="../../eurybia/data/project_info_house_price.yml" # Optional: add information on report
    )
Compile Drift over years
Compile Drift et generate report for Year 2008
[28]:
house_df_2008 = house_df.loc[house_df['YrSold'] == 2008]

y_df_2008=house_df_2008['SalePrice'].to_frame()
X_df_2008=house_df_2008[house_df_2008.columns.difference(['SalePrice','YrSold'])]
[29]:
df_2008_encode=encoder.transform(X_df_2008)
y_pred_2008 = regressor.predict(df_2008_encode)
performance_2008 = mean_squared_log_error(y_df_2008, y_pred_2008).round(6)
performance_2008
[29]:
0.027948
[30]:
df_performance = pd.concat([df_performance, pd.DataFrame([{'annee': 2008, 'mois': 1, 'performance': performance_2008}])], ignore_index=True)
df_performance
[30]:
| annee | mois | performance | |
|---|---|---|---|
| 0 | 2006 | 1 | 0.030775 |
| 1 | 2007 | 1 | 0.032982 |
| 2 | 2007 | 1 | 0.032982 |
| 3 | 2008 | 1 | 0.027948 |
[34]:
X_df_2008["MasVnrType"] = X_df_2008["MasVnrType"].fillna("NR")
X_df_learning["MasVnrType"] = X_df_learning["MasVnrType"].fillna("NR")
SD = SmartDrift(df_current=X_df_2008,
                df_baseline=X_df_learning,
                deployed_model=regressor, # Optional: put in perspective result with importance on deployed model
                encoding=encoder # Optional: if deployed_model and encoder to use this model
               )
[35]:
SD.compile(full_validation=True, # Optional: to save time, leave the default False value. If True, analyze consistency on modalities between columns.
           date_compile_auc = date(2008,1,1), # Optional: useful when computing the drift for a time that is not now
           datadrift_file = "house_price_auc.csv" # Optional: name of the csv file that contains the performance history of data drift
          )
The variable Condition1 has mismatching unique values:
["Within 200' of East-West Railroad"] | []

The variable Condition2 has mismatching unique values:
['Adjacent to arterial street', "Within 200' of North-South Railroad", 'Adjacent to postive off-site feature', 'Near positive off-site feature--park, greenbelt, etc.'] | []

The variable Electrical has mismatching unique values:
['Mixed'] | []

The variable ExterCond has mismatching unique values:
['Excellent'] | []

The variable ExterQual has mismatching unique values:
['Fair'] | []

The variable Exterior1st has mismatching unique values:
[] | ['Imitation Stucco']

The variable Exterior2nd has mismatching unique values:
[] | ['Other', 'Stone']

The variable Foundation has mismatching unique values:
[] | ['Slab', 'Wood']

The variable Functional has mismatching unique values:
['Major Deductions 2'] | []

The variable GarageCond has mismatching unique values:
['Excellent'] | ['Poor']

The variable GarageQual has mismatching unique values:
[] | ['Poor']

The variable GarageType has mismatching unique values:
[] | ['More than one type of garage']

The variable Heating has mismatching unique values:
['Hot water or steam heat other than gas', 'Floor Furnace'] | ['Wall furnace']

The variable MSSubClass has mismatching unique values:
['1-Story w/Finished Attic All Ages'] | []

The variable Neighborhood has mismatching unique values:
['Northpark Villa', 'Bluestem'] | []

The variable RoofMatl has mismatching unique values:
['Membrane', 'Clay or Tile'] | ['Metal']

The variable SaleCondition has mismatching unique values:
[] | ['Sale between family members']

The variable SaleType has mismatching unique values:
['Contract 15% Down payment regular terms', 'Warranty Deed - Cash'] | ['Contract Low Interest', 'Other']

The variable Street has mismatching unique values:
['Gravel'] | []

INFO: Shap explainer type - <shap.explainers._tree.TreeExplainer object at 0x1299716d0>
The computed AUC on the X_test used to build datadrift_classifier is equal to: 0.6877714667557634
[36]:
SD.add_data_modeldrift(dataset=df_performance,metric='performance')
[37]:
SD.generate_report(
    output_file='report_house_price_modeldrift_2008.html',
    title_story="Model drift",
    title_description="""House price model drift 2008""", # Optional: add a subtitle to describe report
    project_info_file="../../eurybia/data/project_info_house_price.yml" # Optional: add information on report
    )
Compile Drift et generate report for Year 2009
[38]:
house_df_2009 = house_df.loc[house_df['YrSold'] == 2009]

y_df_2009=house_df_2009['SalePrice'].to_frame()
X_df_2009=house_df_2009[house_df_2009.columns.difference(['SalePrice','YrSold'])]
[39]:
df_2009_encode=encoder.transform(X_df_2009)
y_pred_2009 = regressor.predict(df_2009_encode)
performance_2009 = mean_squared_log_error(y_df_2009, y_pred_2009).round(6)
performance_2009
[39]:
0.031738
[40]:
X_df_2009["MasVnrType"] = X_df_2009["MasVnrType"].fillna("NR")
X_df_learning["MasVnrType"] = X_df_learning["MasVnrType"].fillna("NR")
SD = SmartDrift(df_current=X_df_2009,
                df_baseline=X_df_learning,
                deployed_model=regressor, # Optional: put in perspective result with importance on deployed model
                encoding=encoder # Optional: if deployed_model and encoder to use this model
               )
[42]:
SD.compile(full_validation=True, # Optional: to save time, leave the default False value. If True, analyze consistency on modalities between columns.
           date_compile_auc = date(2009,1,1), # Optional: useful when computing the drift for a time that is not now
           datadrift_file = "house_price_auc.csv" # Optional: name of the csv file that contains the performance history of data drift
          )
The variable BsmtCond has mismatching unique values:
['Poor -Severe cracking, settling, or wetness'] | []

The variable Condition1 has mismatching unique values:
[] | ['Adjacent to East-West Railroad']

The variable Condition2 has mismatching unique values:
['Adjacent to arterial street'] | []

The variable Electrical has mismatching unique values:
[] | ['60 AMP Fuse Box and mostly knob & tube wiring (poor)']

The variable ExterCond has mismatching unique values:
['Excellent'] | []

The variable ExterQual has mismatching unique values:
['Fair'] | []

The variable Exterior1st has mismatching unique values:
['Brick Common', 'Cinder Block'] | ['Stone', 'Imitation Stucco']

The variable Exterior2nd has mismatching unique values:
['Brick Common', 'Cinder Block'] | ['Other']

The variable Functional has mismatching unique values:
['Major Deductions 2'] | []

The variable GarageCond has mismatching unique values:
['Excellent'] | ['Good']

The variable GarageQual has mismatching unique values:
[] | ['Poor']

The variable GarageType has mismatching unique values:
[] | ['More than one type of garage']

The variable LotConfig has mismatching unique values:
[] | ['Frontage on 3 sides of property']

The variable MSSubClass has mismatching unique values:
['1-Story w/Finished Attic All Ages'] | []

The variable Neighborhood has mismatching unique values:
['Northpark Villa', 'Bluestem'] | ['Veenker']

The variable RoofMatl has mismatching unique values:
[] | ['Metal', 'Wood Shakes']

The variable RoofStyle has mismatching unique values:
['Mansard'] | []

The variable SaleCondition has mismatching unique values:
[] | ['Adjoining Land Purchase']

The variable SaleType has mismatching unique values:
[] | ['Other']

The variable Utilities has mismatching unique values:
['Electricity and Gas Only'] | []

INFO: Shap explainer type - <shap.explainers._tree.TreeExplainer object at 0x12afcf350>
The computed AUC on the X_test used to build datadrift_classifier is equal to: 0.5405695039804042
[43]:
df_performance = pd.concat([df_performance, pd.DataFrame([{'annee': 2009, 'mois': 1, 'performance': performance_2009}])], ignore_index=True)
[44]:
SD.add_data_modeldrift(dataset=df_performance,metric='performance')
[45]:
SD.generate_report(
    output_file='report_house_price_modeldrift_2009.html',
    title_story="Model drift",
    title_description="""House price model drift 2009""", # Optional: add a subtitle to describe report
    project_info_file="../../eurybia/data/project_info_house_price.yml" # Optional: add information on report
    )
Compile Drift et generate report for Year 2010
[46]:
house_df_2010 = house_df.loc[house_df['YrSold'] == 2010]

y_df_2010=house_df_2010['SalePrice'].to_frame()
X_df_2010=house_df_2010[house_df_2010.columns.difference(['SalePrice','YrSold'])]
[47]:
df_2010_encode=encoder.transform(X_df_2010)
y_pred_2010 = regressor.predict(df_2010_encode)
performance_2010 = mean_squared_log_error(y_df_2010, y_pred_2010).round(6)
performance_2010
[47]:
0.023161
[49]:
df_performance = pd.concat([df_performance, pd.DataFrame([{'annee': 2010, 'mois': 1, 'performance': performance_2010}])], ignore_index=True)
[50]:
X_df_2010["MasVnrType"] = X_df_2010["MasVnrType"].fillna("NR")
X_df_learning["MasVnrType"] = X_df_learning["MasVnrType"].fillna("NR")
SD = SmartDrift(df_current=X_df_2010,
                df_baseline=X_df_learning,
                deployed_model=regressor, # Optional: put in perspective result with importance on deployed model
                encoding=encoder # Optional: if deployed_model and encoder to use this model
               )
[51]:
SD.compile(full_validation=True, # Optional: to save time, leave the default False value. If True, analyze consistency on modalities between columns.
           date_compile_auc = date(2010,1,1), # Optional: useful when computing the drift for a time that is not now
           datadrift_file = "house_price_auc.csv" # Optional: name of the csv file that contains the performance history of data drift
          )
The variable Condition1 has mismatching unique values:
["Within 200' of East-West Railroad"] | []

The variable Electrical has mismatching unique values:
[] | ['60 AMP Fuse Box and mostly knob & tube wiring (poor)']

The variable ExterCond has mismatching unique values:
['Poor'] | []

The variable ExterQual has mismatching unique values:
['Fair'] | []

The variable Exterior1st has mismatching unique values:
['Asphalt Shingles'] | ['Stone', 'Imitation Stucco']

The variable Exterior2nd has mismatching unique values:
['Asphalt Shingles', 'Brick Common'] | ['Other', 'Stone']

The variable Functional has mismatching unique values:
[] | ['Major Deductions 1']

The variable GarageCond has mismatching unique values:
[] | ['Poor', 'Good']

The variable GarageQual has mismatching unique values:
[] | ['Good', 'Excellent', 'Poor']

The variable GarageType has mismatching unique values:
[] | ['More than one type of garage']

The variable Heating has mismatching unique values:
[] | ['Gas hot water or steam heat', 'Wall furnace']

The variable HouseStyle has mismatching unique values:
[] | ['Two and one-half story: 2nd level finished', 'One and one-half story: 2nd level unfinished', 'Two and one-half story: 2nd level unfinished']

The variable LotConfig has mismatching unique values:
[] | ['Frontage on 3 sides of property']

The variable LotShape has mismatching unique values:
[] | ['Irregular']

The variable MSSubClass has mismatching unique values:
['1-Story w/Finished Attic All Ages'] | ['2-1/2 Story All Ages', '1-1/2 Story - Unfinished All Ages']

The variable MSZoning has mismatching unique values:
[] | ['Residential High Density']

The variable Neighborhood has mismatching unique values:
['Northpark Villa'] | ['Veenker']

The variable RoofMatl has mismatching unique values:
[] | ['Wood Shingles', 'Metal', 'Gravel & Tar']

The variable RoofStyle has mismatching unique values:
['Mansard', 'Shed'] | ['Flat']

The variable SaleCondition has mismatching unique values:
[] | ['Adjoining Land Purchase']

The variable SaleType has mismatching unique values:
['Contract 15% Down payment regular terms'] | ['Contract Low Down', 'Contract Low Down payment and low interest', 'Other']

The variable Street has mismatching unique values:
['Gravel'] | []

INFO: Shap explainer type - <shap.explainers._tree.TreeExplainer object at 0x13701be50>
The computed AUC on the X_test used to build datadrift_classifier is equal to: 0.6978632478632478
[52]:
SD.add_data_modeldrift(dataset=df_performance,metric='performance')
[53]:
SD.generate_report(
    output_file='report_house_price_modeldrift_2010.html',
    title_story="Model drift",
    title_description="""House price model drift 2010""",
    project_info_file="../../eurybia/data/project_info_house_price.yml"
    )
[ ]:
SD.plot.generate_modeldrift_data() # works if add_data_modeldrift used before