
Detect High Model Drift
With this tutorial you: Understand how to use Eurybia to detect datadrift
This public dataset comes from :
https://www.kaggle.com/sobhanmoosavi/us-accidents/version/10
In this tutorial, the data are not loaded raw, a data preparation to facilitate the use of the tutorial has been done. You can find it here : https://github.com/MAIF/eurybia/blob/master/eurybia/data/dataprep_US_car_accidents.ipynb
[19]:
from datetime import date
import pandas as pd
from category_encoders import OrdinalEncoder
import catboost
from eurybia import SmartDrift
from sklearn.model_selection import train_test_split
from sklearn import metrics
import numpy as np
Import Dataset and split in training and production dataset
[20]:
from eurybia.data.data_loader import data_loading
[21]:
df_car_accident = data_loading("us_car_accident")
[22]:
df_car_accident.head()
[22]:
| Start_Lat | Start_Lng | Distance(mi) | Temperature(F) | Humidity(%) | Visibility(mi) | day_of_week_acc | Nautical_Twilight | season_acc | target | target_multi | year_acc | Description | |
|---|---|---|---|---|---|---|---|---|---|---|---|---|---|
| 0 | 33.0 | -117.1 | 0.0 | 40.0 | 93.0 | 2.0 | 3 | Day | winter | 0 | 2 | 2019 | At Carmel Mountain Rd - Accident. |
| 1 | 29.5 | -98.5 | 0.0 | 83.0 | 65.0 | 10.0 | 4 | Day | summer | 1 | 3 | 2017 | At TX-345-SP/Woodlawn Ave/Exit 567B - Accident. |
| 2 | 32.7 | -96.8 | 0.0 | 88.0 | 57.0 | 10.0 | 0 | Night | summer | 0 | 2 | 2021 | Incident on RUGGED DR near BERKLEY AVE Expect ... |
| 3 | 40.0 | -76.3 | 0.0 | 61.0 | 58.0 | 10.0 | 4 | Day | spring | 0 | 2 | 2020 | At PA-741/Rohrerstown Rd - Accident. |
| 4 | 41.5 | -81.8 | 1.0 | 71.0 | 53.0 | 10.0 | 0 | Day | summer | 0 | 2 | 2020 | At 117th St/Exit 166 - Accident. |
[23]:
df_car_accident.head()
[23]:
| Start_Lat | Start_Lng | Distance(mi) | Temperature(F) | Humidity(%) | Visibility(mi) | day_of_week_acc | Nautical_Twilight | season_acc | target | target_multi | year_acc | Description | |
|---|---|---|---|---|---|---|---|---|---|---|---|---|---|
| 0 | 33.0 | -117.1 | 0.0 | 40.0 | 93.0 | 2.0 | 3 | Day | winter | 0 | 2 | 2019 | At Carmel Mountain Rd - Accident. |
| 1 | 29.5 | -98.5 | 0.0 | 83.0 | 65.0 | 10.0 | 4 | Day | summer | 1 | 3 | 2017 | At TX-345-SP/Woodlawn Ave/Exit 567B - Accident. |
| 2 | 32.7 | -96.8 | 0.0 | 88.0 | 57.0 | 10.0 | 0 | Night | summer | 0 | 2 | 2021 | Incident on RUGGED DR near BERKLEY AVE Expect ... |
| 3 | 40.0 | -76.3 | 0.0 | 61.0 | 58.0 | 10.0 | 4 | Day | spring | 0 | 2 | 2020 | At PA-741/Rohrerstown Rd - Accident. |
| 4 | 41.5 | -81.8 | 1.0 | 71.0 | 53.0 | 10.0 | 0 | Day | summer | 0 | 2 | 2020 | At 117th St/Exit 166 - Accident. |
[24]:
df_car_accident.shape
[24]:
(50000, 13)
[25]:
# Let us consider that the column "year_acc" corresponds to the reference date.
#In 2016, a model was trained using data. And in next years, we want to detect data drift on new data in production to predict
df_accident_baseline = df_car_accident.loc[df_car_accident['year_acc'] == 2016]
df_accident_2017 = df_car_accident.loc[df_car_accident['year_acc'] == 2017]
df_accident_2018 = df_car_accident.loc[df_car_accident['year_acc'] == 2018]
df_accident_2019 = df_car_accident.loc[df_car_accident['year_acc'] == 2019]
df_accident_2020 = df_car_accident.loc[df_car_accident['year_acc'] == 2020]
df_accident_2021 = df_car_accident.loc[df_car_accident['year_acc'] == 2021]
[26]:
#We will train a classification model to predict the severity of an accident. 0 for a less severe accident and 1 for a severe accident.
#Let's check percentage in class 0 and 1
pd.crosstab(df_car_accident.year_acc, df_car_accident.target, normalize = 'index')*100
[26]:
| target | 0 | 1 |
|---|---|---|
| year_acc | ||
| 2016 | 71.406287 | 28.593713 |
| 2017 | 67.254620 | 32.745380 |
| 2018 | 66.634662 | 33.365338 |
| 2019 | 79.551182 | 20.448818 |
| 2020 | 89.944804 | 10.055196 |
| 2021 | 98.259930 | 1.740070 |
[27]:
y_df_learning=df_accident_baseline['target'].to_frame()
X_df_learning=df_accident_baseline[df_accident_baseline.columns.difference(["target", "target_multi", "year_acc", "Description"])]

y_df_2017=df_accident_2017['target'].to_frame()
X_df_2017=df_accident_2017[df_accident_2017.columns.difference(["target", "target_multi", "year_acc", "Description"])]

y_df_2018=df_accident_2018['target'].to_frame()
X_df_2018=df_accident_2018[df_accident_2018.columns.difference(["target", "target_multi", "year_acc", "Description"])]

y_df_2019=df_accident_2019['target'].to_frame()
X_df_2019=df_accident_2019[df_accident_2019.columns.difference(["target", "target_multi", "year_acc", "Description"])]

y_df_2020=df_accident_2020['target'].to_frame()
X_df_2020=df_accident_2020[df_accident_2020.columns.difference(["target", "target_multi", "year_acc", "Description"])]

y_df_2021=df_accident_2021['target'].to_frame()
X_df_2021=df_accident_2021[df_accident_2021.columns.difference(["target", "target_multi", "year_acc", "Description"])]
Building Supervized Model
[28]:
features = ['Start_Lat', 'Start_Lng', 'Distance(mi)', 'Temperature(F)',
       'Humidity(%)', 'Visibility(mi)', 'day_of_week_acc', 'Nautical_Twilight',
       'season_acc']
[29]:
features_to_encode = [col for col in X_df_learning[features].columns if X_df_learning[col].dtype not in ('float64','int64')]

encoder = OrdinalEncoder(cols=features_to_encode)
encoder = encoder.fit(X_df_learning[features])

X_df_learning_encoded=encoder.transform(X_df_learning)
[30]:
Xtrain, Xtest, ytrain, ytest = train_test_split(X_df_learning_encoded, y_df_learning, train_size=0.75, random_state=1)
[31]:
train_pool_cat = catboost.Pool(data=Xtrain, label= ytrain, cat_features = features_to_encode)
test_pool_cat = catboost.Pool(data=Xtest, label= ytest, cat_features = features_to_encode)
[32]:
model = catboost.CatBoostClassifier(loss_function= "Logloss", eval_metric="Logloss",
                                    learning_rate=0.143852,
                                    iterations=300,
                                    l2_leaf_reg=15,
                                    max_depth = 4,
                                    use_best_model=True,
                                    custom_loss=['Accuracy', 'AUC', 'Logloss'])

model = model.fit(train_pool_cat, plot=True,eval_set=test_pool_cat, verbose=False)
[33]:
proba = model.predict_proba(Xtest)
print(metrics.roc_auc_score(ytest,proba[:,1]))
0.764435761049811
Use Eurybia for data validation
[34]:
from eurybia import SmartDrift
[35]:
SD = SmartDrift(df_current=X_df_2017,
                df_baseline=X_df_learning,
                deployed_model=model, # Optional: put in perspective result with importance on deployed model
                encoding=encoder # Optional: if deployed_model and encoder to use this model
               )
[36]:
%time
SD.compile(full_validation=True, # Optional: to save time, leave the default False value. If True, analyze consistency on modalities between columns.
           date_compile_auc = date(2017,1,1), # Optional: useful when computing the drift for a time that is not now
           datadrift_file = "car_accident_auc.csv" # Optional: name of the csv file that contains the performance history of data drift
          )
CPU times: user 0 ns, sys: 0 ns, total: 0 ns
Wall time: 1.67 μs
INFO: Shap explainer type - <shap.explainers._tree.TreeExplainer object at 0x11cb867b0>
The computed AUC on the X_test used to build datadrift_classifier is equal to: 0.6648471037089818
car_accident_auc.csv did not exist and was created.
As soon as compile() method, Eurybia displays default consistency checks as warnings. If some modalities are not present during training and are in production dataset, the deployed model will consider them wrongly. Inversely, if some modalities are present during training and are not in production dataset, it means that some profiles are missing.
Add model drift in report
For the moment, the model drift part of eurybia only consists of displaying performance of deployed model. (We hope to bring new features in the future on this part)
Put model performance in DataFrame
[37]:
proba = model.predict_proba(X_df_2017)
performance = metrics.roc_auc_score(y_df_2017,proba[:,1]).round(5)
[38]:
#Create Dataframe to track performance over the years
df_performance = pd.DataFrame({'annee': [2017], 'mois':[1], 'performance': [performance]})
[39]:
SD.add_data_modeldrift(dataset=df_performance,metric='performance')
[40]:
SD.generate_report(
    output_file='report_car_accident_modeldrift_2017.html',
    title_story="Model drift Report",
    title_description="""US Car accident model drift 2017""", # Optional: add a subtitle to describe report
    project_info_file="../../eurybia/data/project_info_car_accident.yml" # Optional: add information on report
    )
This tutorial contains only anlysis on additional features of model drift. For more detailed information on data drift, you can consult these tutorials : (https://github.com/MAIF/eurybia/tree/master/tutorial/model_drift/tutorial02-datadrift-high-datadrift.ipynb)
Compile Drift over years
Compile Drift et generate report for Year 2018
[41]:
SD = SmartDrift(df_current=X_df_2018,
                df_baseline=X_df_learning,
                deployed_model=model, # Optional: put in perspective result with importance on deployed model
                encoding=encoder # Optional: if deployed_model and encoder to use this model
               )
[42]:
SD.compile(full_validation=True, # Optional: to save time, leave the default False value. If True, analyze consistency on modalities between columns.
           date_compile_auc = date(2018,1,1), # Optional: useful when computing the drift for a time that is not now
           datadrift_file = "car_accident_auc.csv" # Optional: name of the csv file that contains the performance history of data drift
          )
INFO: Shap explainer type - <shap.explainers._tree.TreeExplainer object at 0x11ee582d0>
The computed AUC on the X_test used to build datadrift_classifier is equal to: 0.7047381011643021
[44]:
proba = model.predict_proba(X_df_2018)
performance = metrics.roc_auc_score(y_df_2018,proba[:,1]).round(5)
df_performance = pd.concat([df_performance, pd.DataFrame([{'annee': 2018, 'mois': 1, 'performance': performance}])], ignore_index=True)
Compile Drift et generate report for Year 2019
[45]:
SD = SmartDrift(df_current=X_df_2019,
                df_baseline=X_df_learning,
                deployed_model=model, # Optional: put in perspective result with importance on deployed model
                encoding=encoder # Optional: if deployed_model and encoder to use this model
               )
[46]:
SD.compile(full_validation=True, # Optional: to save time, leave the default False value. If True, analyze consistency on modalities between columns.
           date_compile_auc = date(2019,1,1), # Optional: useful when computing the drift for a time that is not now
           datadrift_file = "car_accident_auc.csv" # Optional: name of the csv file that contains the performance history of data drift
          )
INFO: Shap explainer type - <shap.explainers._tree.TreeExplainer object at 0x11e0f4b90>
The computed AUC on the X_test used to build datadrift_classifier is equal to: 0.7822871980130955
[48]:
proba = model.predict_proba(X_df_2019)
performance = metrics.roc_auc_score(y_df_2019,proba[:,1]).round(5)
df_performance = pd.concat([df_performance, pd.DataFrame([{'annee': 2019, 'mois': 1, 'performance': performance}])], ignore_index=True)
Compile Drift et generate report for Year 2020
[49]:
SD = SmartDrift(df_current=X_df_2020,
                df_baseline=X_df_learning,
                deployed_model=model, # Optional: put in perspective result with importance on deployed model
                encoding=encoder # Optional: if deployed_model and encoder to use this model
               )
[50]:
SD.compile(full_validation=True, # Optional: to save time, leave the default False value. If True, analyze consistency on modalities between columns.
           date_compile_auc = date(2020,1,1), # Optional: useful when computing the drift for a time that is not now
           datadrift_file = "car_accident_auc.csv" # Optional: name of the csv file that contains the performance history of data drift
          )
INFO: Shap explainer type - <shap.explainers._tree.TreeExplainer object at 0x11e9ead70>
The computed AUC on the X_test used to build datadrift_classifier is equal to: 0.797392480824591
[51]:
proba = model.predict_proba(X_df_2020)
performance = metrics.roc_auc_score(y_df_2020,proba[:,1]).round(5)
df_performance = pd.concat([df_performance, pd.DataFrame([{'annee': 2020, 'mois': 1, 'performance': performance}])], ignore_index=True)
Compile Drift et generate report for Year 2021
[52]:
SD = SmartDrift(df_current=X_df_2021,
                df_baseline=X_df_learning,
                deployed_model=model, # Optional: put in perspective result with importance on deployed model
                encoding=encoder # Optional: if deployed_model and encoder to use this model
               )
[53]:
SD.compile(full_validation=True, # Optional: to save time, leave the default False value. If True, analyze consistency on modalities between columns.
           date_compile_auc = date(2021,1,1), # Optional: useful when computing the drift for a time that is not now
           datadrift_file = "car_accident_auc.csv" # Optional: name of the csv file that contains the performance history of data drift
          )
INFO: Shap explainer type - <shap.explainers._tree.TreeExplainer object at 0x11e9e8180>
The computed AUC on the X_test used to build datadrift_classifier is equal to: 0.7480269190539165
[54]:
proba = model.predict_proba(X_df_2021)
performance = metrics.roc_auc_score(y_df_2021,proba[:,1]).round(5)
df_performance = pd.concat([df_performance, pd.DataFrame([{'annee': 2021, 'mois': 1, 'performance': performance}])], ignore_index=True)
[55]:
SD.add_data_modeldrift(dataset=df_performance,metric='performance')
[ ]:
SD.plot.generate_historical_datadrift_metric() # works if date_compile_auc and/or datadrift_file are filled
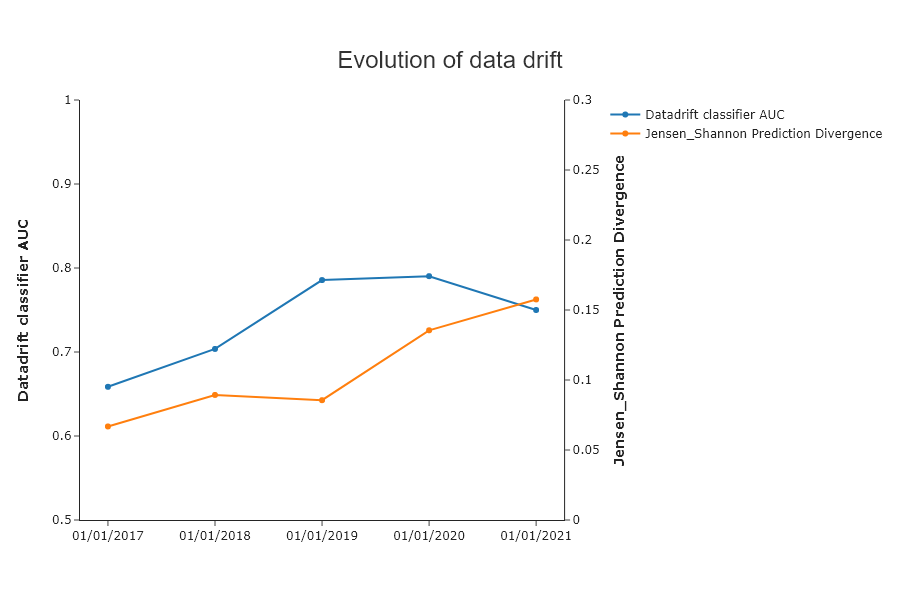
In 2019 and 2020, data drift is very high. Is there any impact on the performance of the model?
[ ]:
SD.plot.generate_modeldrift_data() # works if add_data_modeldrift used before
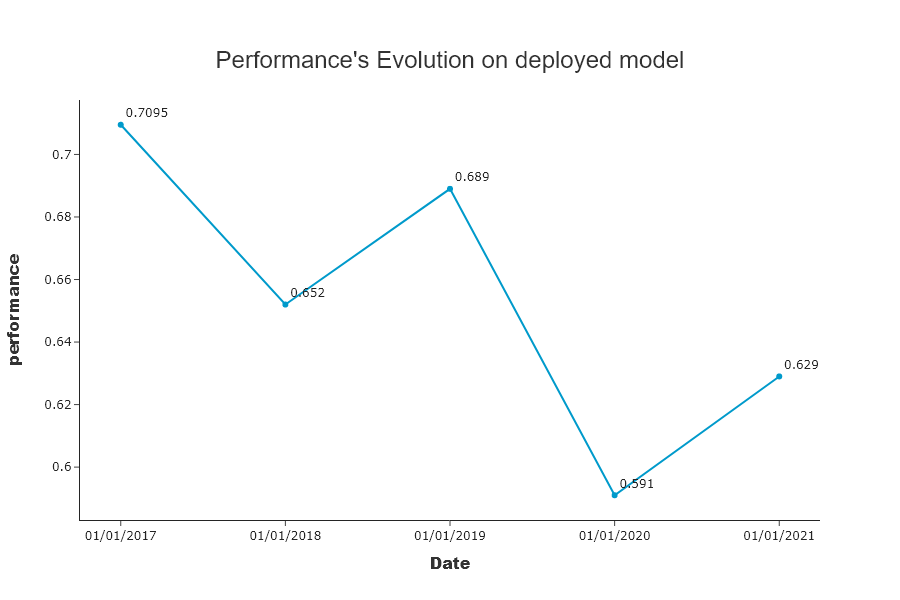
While data drift was high in 2019, the impact on model performance is low. In 2020, data drift leads to a decrease in model performance.
[58]:
SD.generate_report(
    output_file='report_car_accident_modeldrift_2021.html',
    title_story="Model drift Report",
    title_description="""US Car accident model drift 2021""", # Optional: add a subtitle to describe report
    project_info_file="../../eurybia/data/project_info_car_accident.yml" # Optional: add information on report
    )
[ ]: