
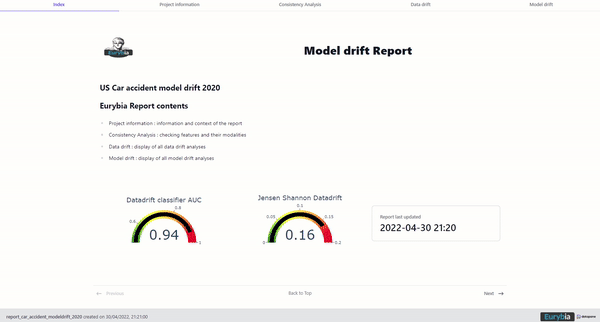
Welcome to Eurybia’s documentation !

Eurybia is a Python library dedicated to the monitoring of Data Science models. It provides several types of visualizations that display through an HTML report (or directly in notebook mode) which help in detecting drift (data drift & model drift). It also support data validation before putting a model into production.
Company |
GitHub Account |
Website |
|---|---|---|

|
The objectives of Eurybia
Help data analysts, data engineers and data scientists to collaborate for data validation before deploying a model into a production environment
Make it easier and faster for data scientists to analyze data drift
Monitoring drift over time
Display clear and understandable insightful report
Eurybia features
Consistency analysis between the baseline dataset and the current dataset
Performance of the data drift classifier
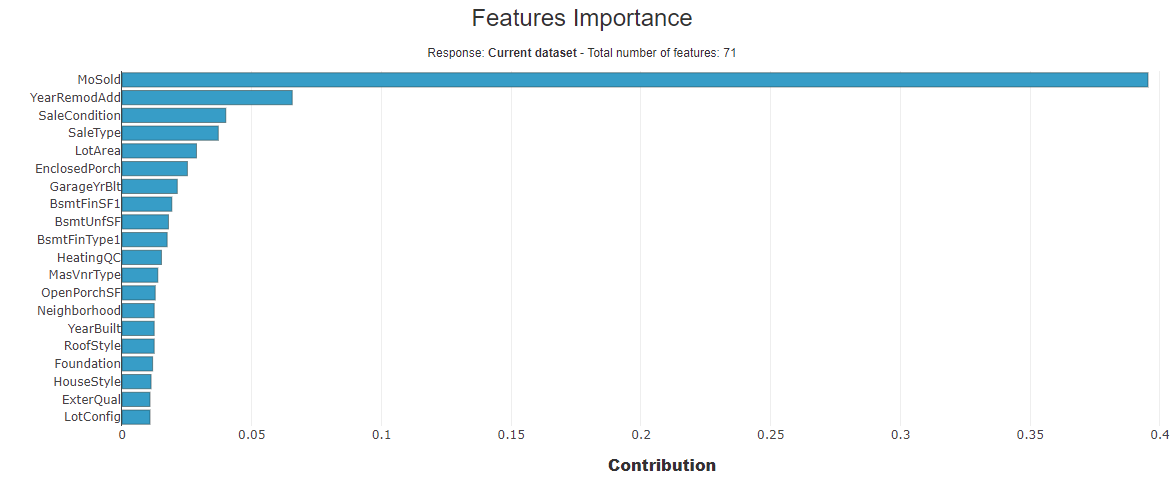
Feature importance: features that discriminate the most two datasets
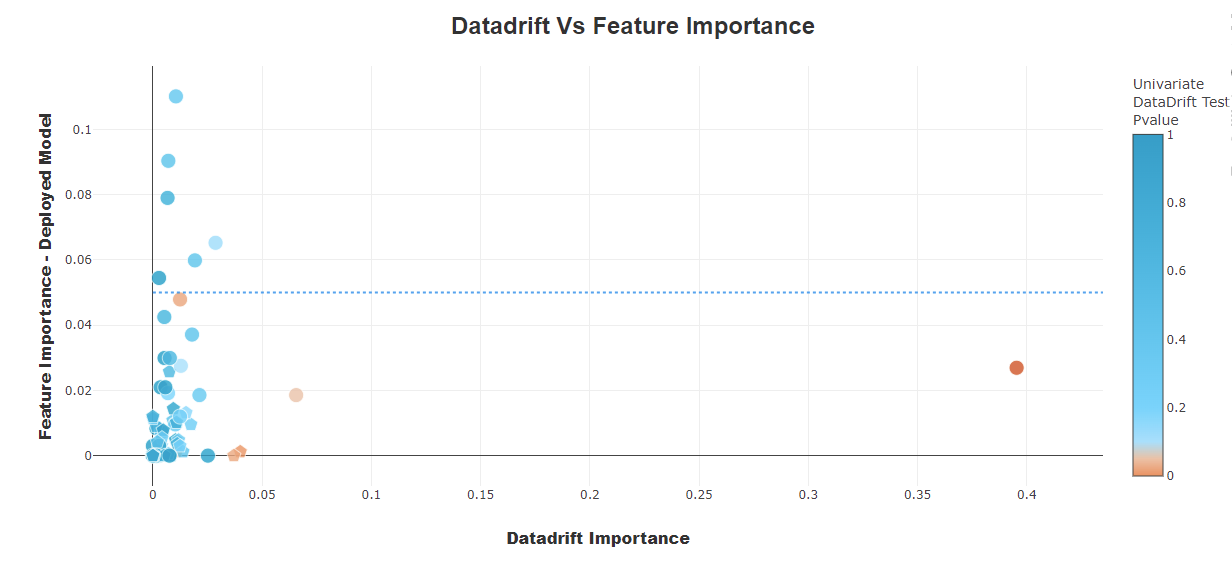
Scatter plot: Putting the drift of a variable into perspective with its importance in the deployed model
Dataset analysis: distribution comparison between variable from the baseline dataset and the current dataset
Predicted values analysis: distribution comparison between predicted probabilities from the baseline dataset and the current dataset
Features contribution for the data drift classifier
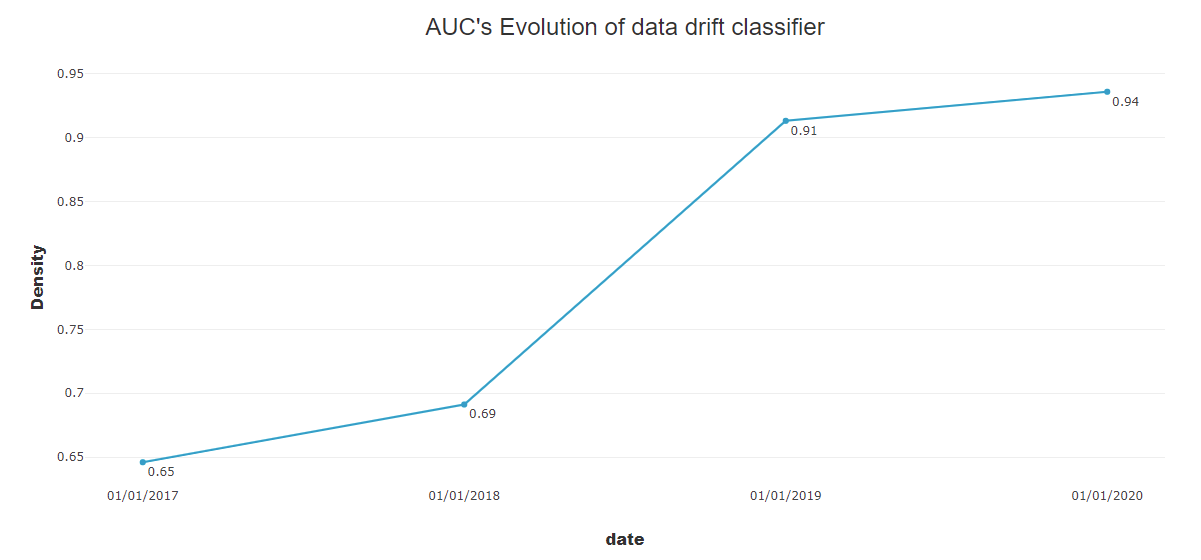
AUC evolution: performance comparison for the data drift classifier over time
Offers several parameters in order to summarize drift in the most suitable way for your use case
Model performance evolution: compare your model performances over time
Eurybia is easy to install and use: It provides a SmartDrift class to understand data and model drift. Plus it ‘s summarized them with a simple syntax.
High adaptability: Very few arguments are required to display results. But the more you work on cleaning and documenting the data, the clearer the results will be for the end user.
License is Apache Software License 2.0